The Report That Makes Your VP Ask
"Who Designed This?"
Save 20+ hours on every dashboard you'll ever build.
Connect your data in under 10 minutes.
ONE-TIME PAYMENT · INSTANT DOWNLOAD
$98 $49
50% OFF
Secure checkout · 30-day money-back guarantee

The visual gap between a Junior and a Senior

STOP PRESENTING THIS...

...SHOW THIS INSTEAD


Let's Be Honest
Hours Lost on Formatting
You didn't get into data analytics to spend your afternoon fixing chart margins.
It Still Looks Amateur
6 hours of work. 3 seconds of feedback. "Can you make it look more professional?"
You know the feeling.
Always Starting From Zero
Every new project. Blank canvas. Just you, a deadline, and the default Power BI theme.
What if your next dashboard was already designed, polished, and ready to impress?
You just open it, plug your data in, and present.
Everything You Need. Nothing You Don't.
Designed by a Microsoft Certified Trainer and Data Analyst Associate with 8+ years of Power BI experience. Every DAX measure, every layout, every design choice is intentional.
Under the Hood

25 Pre-Built DAX Measures
Organized in a dedicated measure table with folders and subfolders. Structured, clean, optimized.

Dynamic Field Parameters
Switch analysis axes on the fly. Month to year, country to continent. One click, the entire report adapts.

Star Schema Data Model
A properly modeled dataset. No spaghetti relationships. Just clean, scalable architecture.

Built-In Page Navigation
Move between pages seamlessly with integrated navigation. No tab clutter.
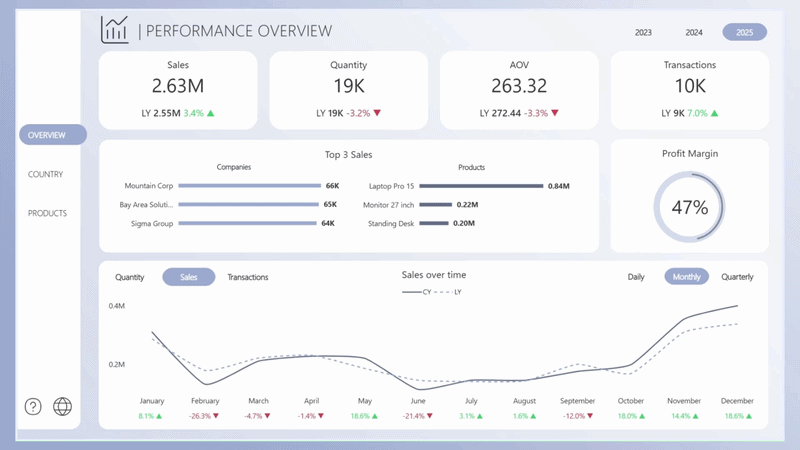
01 PERFORMANCE OVERVIEW
Built for the first 10 seconds of any executive meeting.
◆ New card visuals with conditional indicators showing Year vs Year-1 performance
◆ Top 3 sales highlights, front and center
◆ Donut chart engineered as a margin rate gauge
◆ Dynamic line chart (Y vs Y-1) switchable between quantity, sales, or transactions and between daily, monthly, or quarterly, with a built-in variance indicator that adapts automatically to any axis you choose
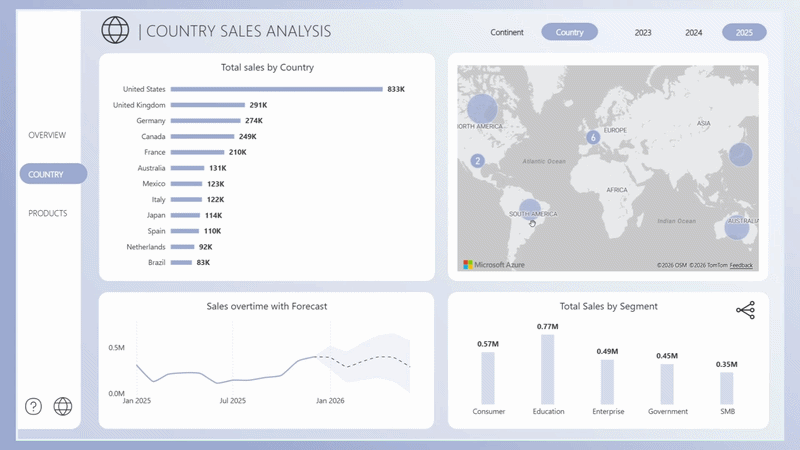
02 GEOGRAPHIC ANALYSIS
Where your revenue comes from. See it, compare it, forecast it.
◆ Interactive map with hover details showing quantity and margin, dynamically adapting to country or continent level
◆ Total transactions visual with a 6 month built-in forecast
◆ Full geographic breakdown for regional sales analysis
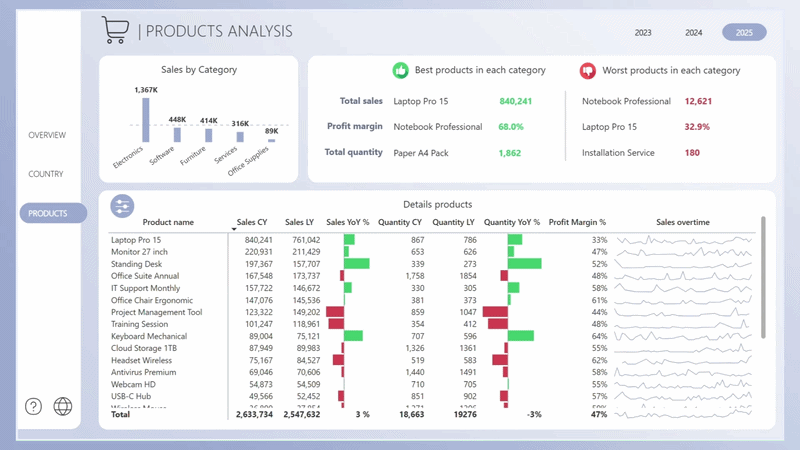
03 PRODUCT DEEP DIVE
Drill into what's working and what's not. Every product, every metric, no guessing.
◆ Top 3 best and worst performing products, instantly visible
◆ Detailed product table with conditional formatting color indicators
◆ Hidden filter panel that appears with one click, clean interface, powerful filtering
◆ Built-in search function to find any product instantly
Make It Yours in Seconds
Your brand, your colors. Change the entire dashboard theme in under 10 clicks. Just pick your colors and the whole report adapts instantly.

What You Get When You Download
Everything delivered straight to your inbox mail within minutes of your purchase.
The .pbix File
The full Power BI template. Open it, connect your data, and you're live.
Sample Dataset
A ready made dataset so you can explore the template immediately before plugging in your own data.
Step by Step Guide
Clear documentation that walks you through setup, customization, and how to make it fully yours.
Ready to Use in 3 Steps
1. Download the .pbix file, pre-loaded with sample data.
2. Swap the sample data with your own source. Excel, SQL, whatever you use.
3. Adjust layouts, and visuals to match your preferences if needed. Then publish.
What This Actually Means for You
Features are nice. Results are better.

Save 20+ Hours Per Dashboard
The full Power BI template. Open it, connect your data, and you're live.

Present With Confidence
No more second guessing your layout, your colors, or your chart choices. Everything is designed to look professional in front of any audience.

Look Like a Senior From Day One
Whether you're a junior analyst or a seasoned consultant, this template makes your output look like it came from someone with a decade of experience.

Reuse It Forever
One purchase, unlimited projects. Adapt it for every new report, every new client, every new team. It pays for itself the first time you use it.
The Expert Framework behind the Beast

I built this because I was tired of seeing brilliant data wasted on ugly, confusing dashboards. With 8+ years of deploying Power BI in high-stakes enterprise environments, I’ve distilled my entire workflow into this 'Beast' framework.
This isn't academic theory, it’s the exact system I use to deliver executive-ready insights for my own clients. No fluff, no broken DAX, just battle-tested efficiency.
Get the Template
One purchase. Lifetime access. No subscription.
The average analyst spends 20+ hours building a dashboard from scratch. At any hourly rate, this template pays for itself the first time you use it.
Got Questions ? We've Got Answers.